1. Data preprocessing and curation
This notebook focuses on the preparation of LPS datasets, including both public and private sources, and demonstrates how to merge them for training the PerturbGen model.
1.1. Public LPS data
import gdown # for downloading files from Google Drive
import requests
Downloading the public LPS dataset
url = 'https://ftp.ebi.ac.uk/biostudies/fire/E-MTAB-/026/E-MTAB-10026/Files/covid_portal_210320_with_raw.h5ad'
output= './Raw_h5ad'
gdown.download(url,output) # download the file
Downloading...
From: https://ftp.ebi.ac.uk/biostudies/fire/E-MTAB-/026/E-MTAB-10026/Files/covid_portal_210320_with_raw.h5ad
To: /home/jovyan/farm_mount/Cytomeister/Evaluation_datasets/LPS/Public_Emily/Raw_h5ad.zip
100%|██████████| 7.19G/7.19G [01:31<00:00, 78.9MB/s]
'./Raw_h5ad.zip'
Import Libraries
import pandas as pd
import scanpy as sc
import numpy as np
import seaborn as sns
# Read the downloaded h5ad file
adata = sc.read('./Raw.h5ad')
Here, we investigate the .h5ad file to identify LPS samples and healthy control cells in the downloaded LPS data.
adata
AnnData object with n_obs × n_vars = 647366 × 24929
    obs: 'sample_id', 'n_genes', 'n_genes_by_counts', 'total_counts', 'total_counts_mt', 'pct_counts_mt', 'full_clustering', 'initial_clustering', 'Resample', 'Collection_Day', 'Sex', 'Age_interval', 'Swab_result', 'Status', 'Smoker', 'Status_on_day_collection', 'Status_on_day_collection_summary', 'Days_from_onset', 'Site', 'time_after_LPS', 'Worst_Clinical_Status', 'Outcome', 'patient_id'
    var: 'feature_types'
    uns: 'hvg', 'leiden', 'neighbors', 'pca', 'umap'
    obsm: 'X_pca', 'X_pca_harmony', 'X_umap'
    layers: 'raw'
adata.obs['time_after_LPS'].value_counts() # check time points available
time_after_LPS
nan    639482
90m      3999
10h      3885
Name: count, dtype: int64
adata.obs['Status'].value_counts() # check conditions available
Status
Covid        527286
Healthy       97039
Non_covid     15157
LPS            7884
Name: count, dtype: int64
lps_sample_ids = adata.obs.loc[adata.obs['Status'] == 'LPS', 'patient_id'].unique() # get patient ids for LPS samples

healthy_sample_ids = adata.obs.loc[adata.obs['Status'] == 'Healthy', 'patient_id'].unique() # get patient ids for Healthy samples
adata = adata[adata.obs['Status'].isin(['LPS','Healthy'])].copy() # keep only LPS and Healthy samples
Next, we apply a set of modifications and add details to make downstream analyses more convenient e.g. converting time obs into categorical obs
adata.obs['time_after_LPS'] = adata.obs['time_after_LPS'].astype(str) # convert to string
adata.obs['time_after_LPS'] = adata.obs['time_after_LPS'].replace('nan', 'normal') # replace nan with normal
adata.obs['time_after_LPS'] = adata.obs['time_after_LPS'].apply(lambda x: x if x == 'normal' else f'{x}_LPS')

adata.obs['time_after_LPS'] = pd.Categorical(
    adata.obs['time_after_LPS'],
    categories=['normal', '90m_LPS', '10h_LPS'],
    ordered=True
)
adata.obs['time_after_LPS'].value_counts()
time_after_LPS
normal     97039
90m_LPS     3999
10h_LPS     3885
Name: count, dtype: int64
adata.obs['donor_id'] = adata.obs['patient_id']
adata.obs['study'] = 'Public_Emily2021'
adata.obs['Age_interval'].value_counts()
Age_interval
(30, 39]    30538
(50, 59]    26344
(20, 29]    20426
(40, 49]    15926
(60, 69]     9970
(70, 79]     1719
Name: count, dtype: int64
mapping = {
    '(20, 29]': 'Adult',
    '(30, 39]': 'Adult',
    '(40, 49]': 'Adult',
    '(50, 59]': 'Adult',
    '(60, 69]': 'Adult',
    '(70, 79]': 'Old'
}
adata.obs['life_stage'] = adata.obs['Age_interval'].map(mapping)


adata.obs['life_stage'] = pd.Categorical(
    adata.obs['life_stage'],
    categories=['Embryo', 'Fetal', 'Childhood', 'Young Adult', 'Adult', 'Old'],
    ordered=True
)
adata.obs['development_stage'] = adata.obs['life_stage']
adata.obs['tissue'] = 'blood'
adata.X = adata.layers['raw'].copy()
adata.X.max()
np.float32(275279.0)
adata.obs['Resample']
covid_index
AAACCTGAGACCACGA-newcastle65    Initial
AAACCTGAGATGTCGG-newcastle65    Initial
AAACCTGAGGCGATAC-newcastle65    Initial
AAACCTGAGTACACCT-newcastle65    Initial
AAACCTGAGTGAATTG-newcastle65    Initial
                                 ...
BGCV15_TTTCCTCTCTGATACG-1       Initial
BGCV15_TTTCCTCTCTTTAGGG-1       Initial
BGCV15_TTTGCGCTCACCGTAA-1       Initial
BGCV15_TTTGGTTTCAAGATCC-1       Initial
BGCV15_TTTGTCACAAGCCATT-1       Initial
Name: Resample, Length: 104923, dtype: category
Categories (1, object): ['Initial']
# Subset to Gene Expression features
adata = adata[:, adata.var['feature_types'] == 'Gene Expression']
ref = pd.read_csv("../../../../Ensembl_symbol_Human_(GRCh38.p14)/mart_export.txt")
adata.var
| feature_types | |
|---|---|
| MIR1302-2HG | Gene Expression |
| AL627309.1 | Gene Expression |
| AL627309.3 | Gene Expression |
| AL627309.2 | Gene Expression |
| AL669831.2 | Gene Expression |
| ... | ... |
| AC007325.2 | Gene Expression |
| AL354822.1 | Gene Expression |
| AC233755.2 | Gene Expression |
| AC233755.1 | Gene Expression |
| AC240274.1 | Gene Expression |
24737 rows × 1 columns
# 1. Convert to string and clean
ref.index = ref.index.astype(str).str.strip().str.upper()
ref["HGNC symbol"] = ref["HGNC symbol"].astype(str).str.strip().str.upper()

# Drop NaNs in gene_symbol (after converting to str 'nan', you can use replace)
ref = ref.replace({"HGNC symbol": {"NAN": None}}).dropna(subset=["HGNC symbol"])

# 2. Map gene_symbol -> ensembl_id by first occurrence
ref_rev = (
    ref.reset_index()
       .drop_duplicates(subset=["HGNC symbol"])
       .set_index("HGNC symbol")["Gene stable ID"]
)

# 3. Map gene_symbol from adata.var_names to ensembl_id
adata.var["gene_symbol"] = adata.var_names.str.strip().str.upper()
adata.var["ensembl_id"] = adata.var["gene_symbol"].map(ref_rev)

# 4. Filter genes without mapping
adata = adata[:, adata.var["ensembl_id"].notna()].copy()

# 5. Set var_names to ensembl_id
adata.var_names = adata.var["ensembl_id"]

print(f"adata now has {adata.n_vars} genes with Ensembl IDs as var_names.")
/tmp/ipykernel_962786/4272093940.py:16: ImplicitModificationWarning: Trying to modify attribute `.var` of view, initializing view as actual.
  adata.var["gene_symbol"] = adata.var_names.str.strip().str.upper()
adata now has 19193 genes with Ensembl IDs as var_names.
adata.var.index.name = 'gene_id'
adata.var
| feature_types | gene_symbol | ensembl_id | |
|---|---|---|---|
| gene_id | |||
| ENSG00000243485 | Gene Expression | MIR1302-2HG | ENSG00000243485 |
| ENSG00000177757 | Gene Expression | FAM87B | ENSG00000177757 |
| ENSG00000225880 | Gene Expression | LINC00115 | ENSG00000225880 |
| ENSG00000230368 | Gene Expression | FAM41C | ENSG00000230368 |
| ENSG00000187634 | Gene Expression | SAMD11 | ENSG00000187634 |
| ... | ... | ... | ... |
| ENSG00000198886 | Gene Expression | MT-ND4 | ENSG00000198886 |
| ENSG00000198786 | Gene Expression | MT-ND5 | ENSG00000198786 |
| ENSG00000198695 | Gene Expression | MT-ND6 | ENSG00000198695 |
| ENSG00000198727 | Gene Expression | MT-CYB | ENSG00000198727 |
| ENSG00000274847 | Gene Expression | MAFIP | ENSG00000274847 |
19193 rows × 3 columns
adata.obs['development_stage']
covid_index
AAACCTGAGACCACGA-newcastle65    Adult
AAACCTGAGATGTCGG-newcastle65    Adult
AAACCTGAGGCGATAC-newcastle65    Adult
AAACCTGAGTACACCT-newcastle65    Adult
AAACCTGAGTGAATTG-newcastle65    Adult
                                ...
BGCV15_TTTCCTCTCTGATACG-1       Adult
BGCV15_TTTCCTCTCTTTAGGG-1       Adult
BGCV15_TTTGCGCTCACCGTAA-1       Adult
BGCV15_TTTGGTTTCAAGATCC-1       Adult
BGCV15_TTTGTCACAAGCCATT-1       Adult
Name: development_stage, Length: 104923, dtype: category
Categories (2, object): ['Adult' < 'Old']
adata.obs['full_clustering'].value_counts()
full_clustering
CD4.Naive                13829
NK_16hi                  13473
CD8.Naive                 8105
CD4.CM                    7505
B_naive                   6908
CD83_CD14_mono            6772
CD8.TE                    6501
CD4.IL22                  6379
CD8.EM                    5734
gdT                       4948
CD14_mono                 3774
MAIT                      3465
CD16_mono                 3007
Platelets                 2363
NK_56hi                   2190
B_switched_memory         1395
DC2                       1052
DC3                        975
B_immature                 966
NKT                        864
CD4.Tfh                    800
pDC                        678
B_non-switched_memory      647
B_exhausted                334
RBC                        301
NK_prolif                  221
ILC1_3                     213
C1_CD16_mono               198
CD4.EM                     188
Plasma_cell_IgA            173
Plasma_cell_IgG            168
DC1                        104
CD4.Th1                    101
Plasmablast                 95
Plasma_cell_IgM             84
Treg                        75
HSC_erythroid               74
CD8.Prolif                  70
HSC_CD38pos                 61
ILC2                        36
CD4.Prolif                  32
CD4.Th2                     16
ASDC                        16
HSC_CD38neg                 13
DC_prolif                    6
HSC_prolif                   6
Mono_prolif                  4
HSC_myeloid                  3
CD4.Th17                     1
Name: count, dtype: int64
adata.obs['cell_type'] = adata.obs['full_clustering'].copy()
cell_type_counts = adata.obs['cell_type'].value_counts()

valid_cell_types = cell_type_counts[cell_type_counts >= 50].index

adata = adata[adata.obs['cell_type'].isin(valid_cell_types)].copy()
adata.obs['time_after_LPS']
covid_index
AAACCTGAGACCACGA-newcastle65    normal
AAACCTGAGATGTCGG-newcastle65    normal
AAACCTGAGGCGATAC-newcastle65    normal
AAACCTGAGTACACCT-newcastle65    normal
AAACCTGAGTGAATTG-newcastle65    normal
                                 ...
BGCV15_TTTCCTCTCTGATACG-1       normal
BGCV15_TTTCCTCTCTTTAGGG-1       normal
BGCV15_TTTGCGCTCACCGTAA-1       normal
BGCV15_TTTGGTTTCAAGATCC-1       normal
BGCV15_TTTGTCACAAGCCATT-1       normal
Name: time_after_LPS, Length: 104790, dtype: category
Categories (3, object): ['normal' < '90m_LPS' < '10h_LPS']
# If data is sparse, it's best to use .X.sum(axis=1).A1
if hasattr(adata.X, 'sum'):
    adata.obs['n_counts'] = np.ravel(adata.X.sum(axis=1))
else:
    adata.obs['n_counts'] = adata.X.sum(axis=1)
adata.obs['n_counts']
covid_index
AAACCTGAGACCACGA-newcastle65    4242.0
AAACCTGAGATGTCGG-newcastle65    4708.0
AAACCTGAGGCGATAC-newcastle65    2858.0
AAACCTGAGTACACCT-newcastle65    5227.0
AAACCTGAGTGAATTG-newcastle65    4012.0
                                 ...
BGCV15_TTTCCTCTCTGATACG-1       5766.0
BGCV15_TTTCCTCTCTTTAGGG-1       7415.0
BGCV15_TTTGCGCTCACCGTAA-1       5168.0
BGCV15_TTTGGTTTCAAGATCC-1       6504.0
BGCV15_TTTGTCACAAGCCATT-1       5246.0
Name: n_counts, Length: 104790, dtype: float32
Eventually, we save the public data
adata.write_h5ad('./Public_LPS_PP.h5ad')
1.2. Private LPS data
This data will be published after the paper publication.
tcell=sc.read_h5ad('/path/to/data1/tcell_raw_matrix_annotated.h5ad')
tcell
AnnData object with n_obs × n_vars = 69370 × 35976
    obs: 'patient_id', 'time_after_LPS', 'Sex', 'age', 'batch', 'IR_VJ_1_locus_tcr', 'IR_VJ_2_locus_tcr', 'IR_VDJ_1_locus_tcr', 'IR_VDJ_2_locus_tcr', 'IR_VJ_1_cdr3_tcr', 'IR_VJ_2_cdr3_tcr', 'IR_VDJ_1_cdr3_tcr', 'IR_VDJ_2_cdr3_tcr', 'IR_VJ_1_cdr3_nt_tcr', 'IR_VJ_2_cdr3_nt_tcr', 'IR_VDJ_1_cdr3_nt_tcr', 'IR_VDJ_2_cdr3_nt_tcr', 'IR_VJ_1_expr_tcr', 'IR_VJ_2_expr_tcr', 'IR_VDJ_1_expr_tcr', 'IR_VDJ_2_expr_tcr', 'IR_VJ_1_expr_raw_tcr', 'IR_VJ_2_expr_raw_tcr', 'IR_VDJ_1_expr_raw_tcr', 'IR_VDJ_2_expr_raw_tcr', 'IR_VJ_1_v_gene_tcr', 'IR_VJ_2_v_gene_tcr', 'IR_VDJ_1_v_gene_tcr', 'IR_VDJ_2_v_gene_tcr', 'IR_VJ_1_d_gene_tcr', 'IR_VJ_2_d_gene_tcr', 'IR_VDJ_1_d_gene_tcr', 'IR_VDJ_2_d_gene_tcr', 'IR_VJ_1_j_gene_tcr', 'IR_VJ_2_j_gene_tcr', 'IR_VDJ_1_j_gene_tcr', 'IR_VDJ_2_j_gene_tcr', 'IR_VJ_1_c_gene_tcr', 'IR_VJ_2_c_gene_tcr', 'IR_VDJ_1_c_gene_tcr', 'IR_VDJ_2_c_gene_tcr', 'IR_VJ_1_junction_ins_tcr', 'IR_VJ_2_junction_ins_tcr', 'IR_VDJ_1_junction_ins_tcr', 'IR_VDJ_2_junction_ins_tcr', 'has_ir_tcr', 'multi_chain_tcr', 'IR_VJ_1_locus_bcr', 'IR_VJ_2_locus_bcr', 'IR_VDJ_1_locus_bcr', 'IR_VDJ_2_locus_bcr', 'IR_VJ_1_cdr3_bcr', 'IR_VJ_2_cdr3_bcr', 'IR_VDJ_1_cdr3_bcr', 'IR_VDJ_2_cdr3_bcr', 'IR_VJ_1_cdr3_nt_bcr', 'IR_VJ_2_cdr3_nt_bcr', 'IR_VDJ_1_cdr3_nt_bcr', 'IR_VDJ_2_cdr3_nt_bcr', 'IR_VJ_1_expr_bcr', 'IR_VJ_2_expr_bcr', 'IR_VDJ_1_expr_bcr', 'IR_VDJ_2_expr_bcr', 'IR_VJ_1_expr_raw_bcr', 'IR_VJ_2_expr_raw_bcr', 'IR_VDJ_1_expr_raw_bcr', 'IR_VDJ_2_expr_raw_bcr', 'IR_VJ_1_v_gene_bcr', 'IR_VJ_2_v_gene_bcr', 'IR_VDJ_1_v_gene_bcr', 'IR_VDJ_2_v_gene_bcr', 'IR_VJ_1_d_gene_bcr', 'IR_VJ_2_d_gene_bcr', 'IR_VDJ_1_d_gene_bcr', 'IR_VDJ_2_d_gene_bcr', 'IR_VJ_1_j_gene_bcr', 'IR_VJ_2_j_gene_bcr', 'IR_VDJ_1_j_gene_bcr', 'IR_VDJ_2_j_gene_bcr', 'IR_VJ_1_c_gene_bcr', 'IR_VJ_2_c_gene_bcr', 'IR_VDJ_1_c_gene_bcr', 'IR_VDJ_2_c_gene_bcr', 'IR_VJ_1_junction_ins_bcr', 'IR_VJ_2_junction_ins_bcr', 'IR_VDJ_1_junction_ins_bcr', 'IR_VDJ_2_junction_ins_bcr', 'has_ir_bcr', 'multi_chain_bcr', 'scr_th', 'doublet_scores', 'cal_th', 'scr_predicted_doublets', 'cal_dobulets', 'data_batch', 'individual_id', 'n_genes', 'n_genes_by_counts', 'total_counts', 'total_counts_mt', 'pct_counts_mt', 'cell_typist_full_predicted_labels', 'cell_typist_full_majority_voting', 'cell_typist_initial_predicted_labels', 'cell_typist_initial_majority_voting', 'final_anno', 'timeline', 'sample_id', 'all_T'
    var: 'gene_ids', 'mt', 'n_cells_by_counts', 'mean_counts', 'pct_dropout_by_counts', 'total_counts', 'GEX'
bcell=sc.read_h5ad('/path/to/data2/bcell_raw_matrix_annotated_allanno.h5ad')
bcell
AnnData object with n_obs × n_vars = 11964 × 36601
    obs: 'patient_id', 'time_after_LPS', 'Sex', 'age', 'batch', 'IR_VJ_1_locus_tcr', 'IR_VJ_2_locus_tcr', 'IR_VDJ_1_locus_tcr', 'IR_VDJ_2_locus_tcr', 'IR_VJ_1_cdr3_tcr', 'IR_VJ_2_cdr3_tcr', 'IR_VDJ_1_cdr3_tcr', 'IR_VDJ_2_cdr3_tcr', 'IR_VJ_1_cdr3_nt_tcr', 'IR_VJ_2_cdr3_nt_tcr', 'IR_VDJ_1_cdr3_nt_tcr', 'IR_VDJ_2_cdr3_nt_tcr', 'IR_VJ_1_expr_tcr', 'IR_VJ_2_expr_tcr', 'IR_VDJ_1_expr_tcr', 'IR_VDJ_2_expr_tcr', 'IR_VJ_1_expr_raw_tcr', 'IR_VJ_2_expr_raw_tcr', 'IR_VDJ_1_expr_raw_tcr', 'IR_VDJ_2_expr_raw_tcr', 'IR_VJ_1_v_gene_tcr', 'IR_VJ_2_v_gene_tcr', 'IR_VDJ_1_v_gene_tcr', 'IR_VDJ_2_v_gene_tcr', 'IR_VJ_1_d_gene_tcr', 'IR_VJ_2_d_gene_tcr', 'IR_VDJ_1_d_gene_tcr', 'IR_VDJ_2_d_gene_tcr', 'IR_VJ_1_j_gene_tcr', 'IR_VJ_2_j_gene_tcr', 'IR_VDJ_1_j_gene_tcr', 'IR_VDJ_2_j_gene_tcr', 'IR_VJ_1_c_gene_tcr', 'IR_VJ_2_c_gene_tcr', 'IR_VDJ_1_c_gene_tcr', 'IR_VDJ_2_c_gene_tcr', 'IR_VJ_1_junction_ins_tcr', 'IR_VJ_2_junction_ins_tcr', 'IR_VDJ_1_junction_ins_tcr', 'IR_VDJ_2_junction_ins_tcr', 'has_ir_tcr', 'multi_chain_tcr', 'IR_VJ_1_locus_bcr', 'IR_VJ_2_locus_bcr', 'IR_VDJ_1_locus_bcr', 'IR_VDJ_2_locus_bcr', 'IR_VJ_1_cdr3_bcr', 'IR_VJ_2_cdr3_bcr', 'IR_VDJ_1_cdr3_bcr', 'IR_VDJ_2_cdr3_bcr', 'IR_VJ_1_cdr3_nt_bcr', 'IR_VJ_2_cdr3_nt_bcr', 'IR_VDJ_1_cdr3_nt_bcr', 'IR_VDJ_2_cdr3_nt_bcr', 'IR_VJ_1_expr_bcr', 'IR_VJ_2_expr_bcr', 'IR_VDJ_1_expr_bcr', 'IR_VDJ_2_expr_bcr', 'IR_VJ_1_expr_raw_bcr', 'IR_VJ_2_expr_raw_bcr', 'IR_VDJ_1_expr_raw_bcr', 'IR_VDJ_2_expr_raw_bcr', 'IR_VJ_1_v_gene_bcr', 'IR_VJ_2_v_gene_bcr', 'IR_VDJ_1_v_gene_bcr', 'IR_VDJ_2_v_gene_bcr', 'IR_VJ_1_d_gene_bcr', 'IR_VJ_2_d_gene_bcr', 'IR_VDJ_1_d_gene_bcr', 'IR_VDJ_2_d_gene_bcr', 'IR_VJ_1_j_gene_bcr', 'IR_VJ_2_j_gene_bcr', 'IR_VDJ_1_j_gene_bcr', 'IR_VDJ_2_j_gene_bcr', 'IR_VJ_1_c_gene_bcr', 'IR_VJ_2_c_gene_bcr', 'IR_VDJ_1_c_gene_bcr', 'IR_VDJ_2_c_gene_bcr', 'IR_VJ_1_junction_ins_bcr', 'IR_VJ_2_junction_ins_bcr', 'IR_VDJ_1_junction_ins_bcr', 'IR_VDJ_2_junction_ins_bcr', 'has_ir_bcr', 'multi_chain_bcr', 'scr_th', 'doublet_scores', 'cal_th', 'scr_predicted_doublets', 'cal_dobulets', 'data_batch', 'individual_id', 'n_genes', 'n_genes_by_counts', 'total_counts', 'total_counts_mt', 'pct_counts_mt', 'cell_typist_full_predicted_labels', 'cell_typist_full_majority_voting', 'cell_typist_initial_predicted_labels', 'cell_typist_initial_majority_voting', 'final_anno', 'final_anno1', 'timeline', 'sample_id', 'all_B'
    var: 'gene_ids', 'mt', 'n_cells_by_counts', 'mean_counts', 'pct_dropout_by_counts', 'total_counts'
myeloid=sc.read_h5ad('/path/to/data3/mcell_raw_matrix_annotated.h5ad')
combined_data=tcell.concatenate(bcell,myeloid) # combine the three datasets
/tmp/ipykernel_968620/3716584077.py:1: FutureWarning: Use anndata.concat instead of AnnData.concatenate, AnnData.concatenate is deprecated and will be removed in the future. See the tutorial for concat at: https://anndata.readthedocs.io/en/latest/concatenation.html
  combined_data=tcell.concatenate(bcell,myeloid)
combined_data # check combined data
AnnData object with n_obs × n_vars = 122263 × 35976
    obs: 'patient_id', 'time_after_LPS', 'Sex', 'age', 'batch', 'IR_VJ_1_locus_tcr', 'IR_VJ_2_locus_tcr', 'IR_VDJ_1_locus_tcr', 'IR_VDJ_2_locus_tcr', 'IR_VJ_1_cdr3_tcr', 'IR_VJ_2_cdr3_tcr', 'IR_VDJ_1_cdr3_tcr', 'IR_VDJ_2_cdr3_tcr', 'IR_VJ_1_cdr3_nt_tcr', 'IR_VJ_2_cdr3_nt_tcr', 'IR_VDJ_1_cdr3_nt_tcr', 'IR_VDJ_2_cdr3_nt_tcr', 'IR_VJ_1_expr_tcr', 'IR_VJ_2_expr_tcr', 'IR_VDJ_1_expr_tcr', 'IR_VDJ_2_expr_tcr', 'IR_VJ_1_expr_raw_tcr', 'IR_VJ_2_expr_raw_tcr', 'IR_VDJ_1_expr_raw_tcr', 'IR_VDJ_2_expr_raw_tcr', 'IR_VJ_1_v_gene_tcr', 'IR_VJ_2_v_gene_tcr', 'IR_VDJ_1_v_gene_tcr', 'IR_VDJ_2_v_gene_tcr', 'IR_VJ_1_d_gene_tcr', 'IR_VJ_2_d_gene_tcr', 'IR_VDJ_1_d_gene_tcr', 'IR_VDJ_2_d_gene_tcr', 'IR_VJ_1_j_gene_tcr', 'IR_VJ_2_j_gene_tcr', 'IR_VDJ_1_j_gene_tcr', 'IR_VDJ_2_j_gene_tcr', 'IR_VJ_1_c_gene_tcr', 'IR_VJ_2_c_gene_tcr', 'IR_VDJ_1_c_gene_tcr', 'IR_VDJ_2_c_gene_tcr', 'IR_VJ_1_junction_ins_tcr', 'IR_VJ_2_junction_ins_tcr', 'IR_VDJ_1_junction_ins_tcr', 'IR_VDJ_2_junction_ins_tcr', 'has_ir_tcr', 'multi_chain_tcr', 'IR_VJ_1_locus_bcr', 'IR_VJ_2_locus_bcr', 'IR_VDJ_1_locus_bcr', 'IR_VDJ_2_locus_bcr', 'IR_VJ_1_cdr3_bcr', 'IR_VJ_2_cdr3_bcr', 'IR_VDJ_1_cdr3_bcr', 'IR_VDJ_2_cdr3_bcr', 'IR_VJ_1_cdr3_nt_bcr', 'IR_VJ_2_cdr3_nt_bcr', 'IR_VDJ_1_cdr3_nt_bcr', 'IR_VDJ_2_cdr3_nt_bcr', 'IR_VJ_1_expr_bcr', 'IR_VJ_2_expr_bcr', 'IR_VDJ_1_expr_bcr', 'IR_VDJ_2_expr_bcr', 'IR_VJ_1_expr_raw_bcr', 'IR_VJ_2_expr_raw_bcr', 'IR_VDJ_1_expr_raw_bcr', 'IR_VDJ_2_expr_raw_bcr', 'IR_VJ_1_v_gene_bcr', 'IR_VJ_2_v_gene_bcr', 'IR_VDJ_1_v_gene_bcr', 'IR_VDJ_2_v_gene_bcr', 'IR_VJ_1_d_gene_bcr', 'IR_VJ_2_d_gene_bcr', 'IR_VDJ_1_d_gene_bcr', 'IR_VDJ_2_d_gene_bcr', 'IR_VJ_1_j_gene_bcr', 'IR_VJ_2_j_gene_bcr', 'IR_VDJ_1_j_gene_bcr', 'IR_VDJ_2_j_gene_bcr', 'IR_VJ_1_c_gene_bcr', 'IR_VJ_2_c_gene_bcr', 'IR_VDJ_1_c_gene_bcr', 'IR_VDJ_2_c_gene_bcr', 'IR_VJ_1_junction_ins_bcr', 'IR_VJ_2_junction_ins_bcr', 'IR_VDJ_1_junction_ins_bcr', 'IR_VDJ_2_junction_ins_bcr', 'has_ir_bcr', 'multi_chain_bcr', 'scr_th', 'doublet_scores', 'cal_th', 'scr_predicted_doublets', 'cal_dobulets', 'data_batch', 'individual_id', 'n_genes', 'n_genes_by_counts', 'total_counts', 'total_counts_mt', 'pct_counts_mt', 'cell_typist_full_predicted_labels', 'cell_typist_full_majority_voting', 'cell_typist_initial_predicted_labels', 'cell_typist_initial_majority_voting', 'final_anno', 'timeline', 'sample_id', 'all_T', 'final_anno1', 'all_B'
    var: 'gene_ids', 'mt', 'n_cells_by_counts', 'mean_counts', 'pct_dropout_by_counts', 'total_counts', 'GEX-0', 'GEX-2'
Next, we apply a set of modifications, QC analyses and preprocessing as data is raw
# mitochondrial genes
combined_data.var["mt"] = combined_data.var_names.str.startswith("MT-")
# ribosomal genes
combined_data.var["ribo"] = combined_data.var_names.str.startswith(("RPS", "RPL"))
# hemoglobin genes.
combined_data.var["hb"] = combined_data.var_names.str.contains(("^HB[^(P)]"))
sc.pp.calculate_qc_metrics( # calculate QC metrics
    combined_data, qc_vars=["mt", "ribo", "hb"], inplace=True, percent_top=[20], log1p=True
)
combined_data
AnnData object with n_obs × n_vars = 122263 × 35976
    obs: 'patient_id', 'time_after_LPS', 'Sex', 'age', 'batch', 'IR_VJ_1_locus_tcr', 'IR_VJ_2_locus_tcr', 'IR_VDJ_1_locus_tcr', 'IR_VDJ_2_locus_tcr', 'IR_VJ_1_cdr3_tcr', 'IR_VJ_2_cdr3_tcr', 'IR_VDJ_1_cdr3_tcr', 'IR_VDJ_2_cdr3_tcr', 'IR_VJ_1_cdr3_nt_tcr', 'IR_VJ_2_cdr3_nt_tcr', 'IR_VDJ_1_cdr3_nt_tcr', 'IR_VDJ_2_cdr3_nt_tcr', 'IR_VJ_1_expr_tcr', 'IR_VJ_2_expr_tcr', 'IR_VDJ_1_expr_tcr', 'IR_VDJ_2_expr_tcr', 'IR_VJ_1_expr_raw_tcr', 'IR_VJ_2_expr_raw_tcr', 'IR_VDJ_1_expr_raw_tcr', 'IR_VDJ_2_expr_raw_tcr', 'IR_VJ_1_v_gene_tcr', 'IR_VJ_2_v_gene_tcr', 'IR_VDJ_1_v_gene_tcr', 'IR_VDJ_2_v_gene_tcr', 'IR_VJ_1_d_gene_tcr', 'IR_VJ_2_d_gene_tcr', 'IR_VDJ_1_d_gene_tcr', 'IR_VDJ_2_d_gene_tcr', 'IR_VJ_1_j_gene_tcr', 'IR_VJ_2_j_gene_tcr', 'IR_VDJ_1_j_gene_tcr', 'IR_VDJ_2_j_gene_tcr', 'IR_VJ_1_c_gene_tcr', 'IR_VJ_2_c_gene_tcr', 'IR_VDJ_1_c_gene_tcr', 'IR_VDJ_2_c_gene_tcr', 'IR_VJ_1_junction_ins_tcr', 'IR_VJ_2_junction_ins_tcr', 'IR_VDJ_1_junction_ins_tcr', 'IR_VDJ_2_junction_ins_tcr', 'has_ir_tcr', 'multi_chain_tcr', 'IR_VJ_1_locus_bcr', 'IR_VJ_2_locus_bcr', 'IR_VDJ_1_locus_bcr', 'IR_VDJ_2_locus_bcr', 'IR_VJ_1_cdr3_bcr', 'IR_VJ_2_cdr3_bcr', 'IR_VDJ_1_cdr3_bcr', 'IR_VDJ_2_cdr3_bcr', 'IR_VJ_1_cdr3_nt_bcr', 'IR_VJ_2_cdr3_nt_bcr', 'IR_VDJ_1_cdr3_nt_bcr', 'IR_VDJ_2_cdr3_nt_bcr', 'IR_VJ_1_expr_bcr', 'IR_VJ_2_expr_bcr', 'IR_VDJ_1_expr_bcr', 'IR_VDJ_2_expr_bcr', 'IR_VJ_1_expr_raw_bcr', 'IR_VJ_2_expr_raw_bcr', 'IR_VDJ_1_expr_raw_bcr', 'IR_VDJ_2_expr_raw_bcr', 'IR_VJ_1_v_gene_bcr', 'IR_VJ_2_v_gene_bcr', 'IR_VDJ_1_v_gene_bcr', 'IR_VDJ_2_v_gene_bcr', 'IR_VJ_1_d_gene_bcr', 'IR_VJ_2_d_gene_bcr', 'IR_VDJ_1_d_gene_bcr', 'IR_VDJ_2_d_gene_bcr', 'IR_VJ_1_j_gene_bcr', 'IR_VJ_2_j_gene_bcr', 'IR_VDJ_1_j_gene_bcr', 'IR_VDJ_2_j_gene_bcr', 'IR_VJ_1_c_gene_bcr', 'IR_VJ_2_c_gene_bcr', 'IR_VDJ_1_c_gene_bcr', 'IR_VDJ_2_c_gene_bcr', 'IR_VJ_1_junction_ins_bcr', 'IR_VJ_2_junction_ins_bcr', 'IR_VDJ_1_junction_ins_bcr', 'IR_VDJ_2_junction_ins_bcr', 'has_ir_bcr', 'multi_chain_bcr', 'scr_th', 'doublet_scores', 'cal_th', 'scr_predicted_doublets', 'cal_dobulets', 'data_batch', 'individual_id', 'n_genes', 'n_genes_by_counts', 'total_counts', 'total_counts_mt', 'pct_counts_mt', 'cell_typist_full_predicted_labels', 'cell_typist_full_majority_voting', 'cell_typist_initial_predicted_labels', 'cell_typist_initial_majority_voting', 'final_anno', 'timeline', 'sample_id', 'all_T', 'final_anno1', 'all_B', 'log1p_n_genes_by_counts', 'log1p_total_counts', 'pct_counts_in_top_20_genes', 'log1p_total_counts_mt', 'total_counts_ribo', 'log1p_total_counts_ribo', 'pct_counts_ribo', 'total_counts_hb', 'log1p_total_counts_hb', 'pct_counts_hb'
    var: 'gene_ids', 'mt', 'n_cells_by_counts', 'mean_counts', 'pct_dropout_by_counts', 'total_counts', 'GEX-0', 'GEX-2', 'ribo', 'hb', 'log1p_mean_counts', 'log1p_total_counts'
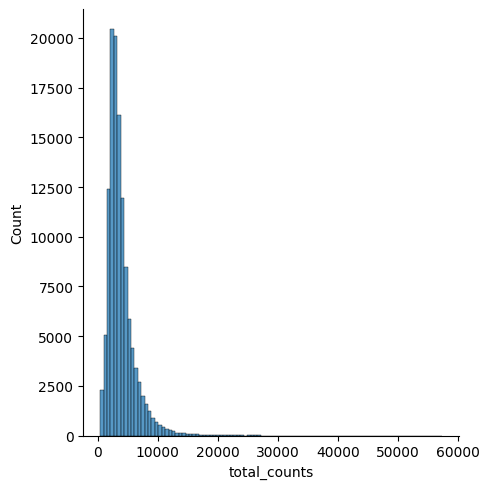
Visualize QC metrics
p1 = sns.displot(combined_data.obs["total_counts"], bins=100, kde=False)
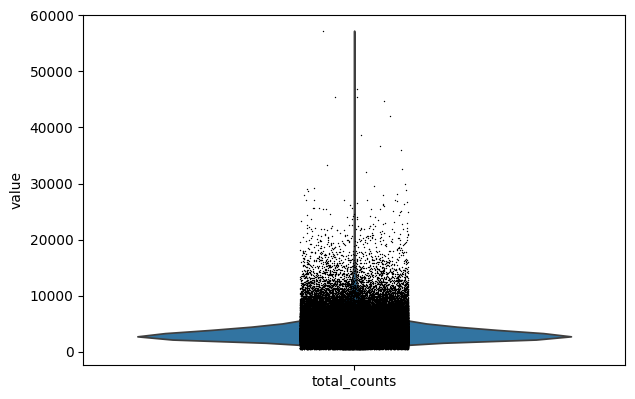
sc.pl.violin(combined_data, 'total_counts')
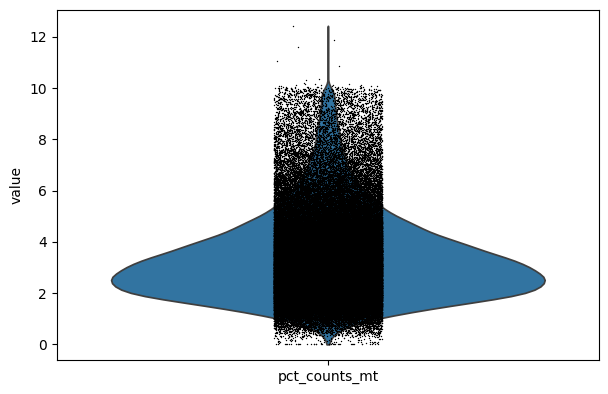
p2 = sc.pl.violin(combined_data, "pct_counts_mt")
p3 = sc.pl.scatter(combined_data, "total_counts", "n_genes_by_counts", color="pct_counts_mt")
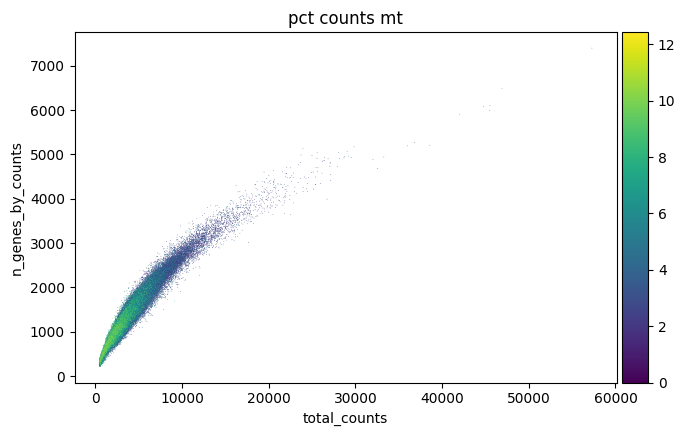
combined_data = combined_data[combined_data.obs['pct_counts_mt'] <= 8] # filter cells with high mitochondrial content
sc.pp.filter_cells(combined_data, max_counts=150000) # filter cells with too many counts
/software/cellgen/team361/am74/envs/pertpy/lib/python3.9/site-packages/scanpy/preprocessing/_simple.py:165: ImplicitModificationWarning: Trying to modify attribute `.obs` of view, initializing view as actual.
  adata.obs["n_counts"] = number
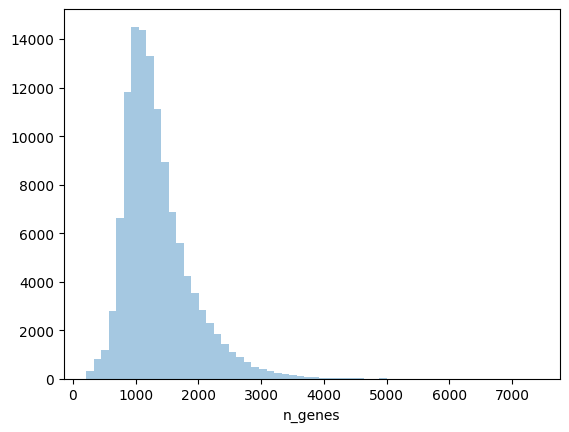
combined_data.obs['n_genes'] = (combined_data.X > 0).sum(1) # calculate number of genes per cell
sns.distplot(combined_data.obs['n_genes'], kde=False, bins=60) # visualize number of genes per cell
/tmp/ipykernel_968620/3987137127.py:2: UserWarning:

`distplot` is a deprecated function and will be removed in seaborn v0.14.0.

Please adapt your code to use either `displot` (a figure-level function with
similar flexibility) or `histplot` (an axes-level function for histograms).

For a guide to updating your code to use the new functions, please see
https://gist.github.com/mwaskom/de44147ed2974457ad6372750bbe5751

  sns.distplot(combined_data.obs['n_genes'], kde=False, bins=60)
<Axes: xlabel='n_genes'>
sc.pp.filter_genes(combined_data, min_cells=20) # filter genes expressed in less than 20 cells
print('Number of genes after cell filter: {:d}'.format(combined_data.n_vars))
Number of genes after cell filter: 19186
combined_data.obs['batch'] = combined_data.obs['batch'].cat.rename_categories({
    '0': 'T cell lineage',
    '1': 'B cell lineage',
    '2': 'Myeloid lineage'
})
combined_data.obs['final_anno'].value_counts()
final_anno
CD14mono                     23888
CD4_naive                    18268
CD8_naive                    13249
CD4_memory                   10259
CD8_EM                        8869
B_naive                       8185
Int.mono                      7229
NK_CD56dim                    4922
CD14mono_M1                   4129
gdT                           3325
MAIT                          2577
Treg                          2382
NKT                           2376
non-swtiched memory           1583
CD16mono                      1213
switched memory               1158
CD8_CM                        1004
DC2                            972
Platelet                       862
NK_CD56bright                  856
pDC                            696
DC3                            488
non-switched memory/CD11c      301
HSPC                           227
plasma_IgA                     160
DC1                             60
plasma_dividing                 50
plasma_IgG                      31
ASDC                            23
plasma_IgM                      18
Name: count, dtype: int64
combined_data.X.max() # check max counts after filtering
2717.0
combined_data.obs['cell_type'] = combined_data.obs['final_anno'] # set cell_type based on final_anno
combined_data.obs['patient_id']
AAACCTGAGACAAAGG-1-0    IVLPS01_Baseline
AAACCTGAGCGTTCCG-1-0    IVLPS01_Baseline
AAACCTGAGTGTTTGC-1-0    IVLPS01_Baseline
AAACCTGCAAACTGTC-1-0    IVLPS01_Baseline
AAACCTGCACAACGTT-1-0    IVLPS01_Baseline
                              ...
TTTGGTTTCGGAATCT-1-2         IVLPS12_10h
TTTGTCAAGGCATGTG-1-2         IVLPS12_10h
TTTGTCACAAAGGAAG-1-2         IVLPS12_10h
TTTGTCATCAACACTG-1-2         IVLPS12_10h
TTTGTCATCACAACGT-1-2         IVLPS12_10h
Name: patient_id, Length: 119360, dtype: category
Categories (23, object): ['IVLPS01_10h', 'IVLPS01_6h', 'IVLPS01_90min', 'IVLPS01_Baseline', ..., 'IVLPS06_Baseline', 'IVLPS12_10h', 'IVLPS12_6h', 'IVLPS12_90min']
combined_data.obs['donor_id'] = combined_data.obs['patient_id'].copy()
combined_data.obs['time_after_LPS']
AAACCTGAGACAAAGG-1-0     0m
AAACCTGAGCGTTCCG-1-0     0m
AAACCTGAGTGTTTGC-1-0     0m
AAACCTGCAAACTGTC-1-0     0m
AAACCTGCACAACGTT-1-0     0m
                       ...
TTTGGTTTCGGAATCT-1-2    10h
TTTGTCAAGGCATGTG-1-2    10h
TTTGTCACAAAGGAAG-1-2    10h
TTTGTCATCAACACTG-1-2    10h
TTTGTCATCACAACGT-1-2    10h
Name: time_after_LPS, Length: 119360, dtype: category
Categories (4, object): ['0m', '10h', '6h', '90m']
combined_data.obs['time_after_LPS'] = combined_data.obs['time_after_LPS'].cat.rename_categories({
    '0m': 'normal',
    '10h': '10h_LPS',
    '6h': '6h_LPS',
    '90m': '90m_LPS'
})
combined_data.obs['time_after_LPS']
AAACCTGAGACAAAGG-1-0     normal
AAACCTGAGCGTTCCG-1-0     normal
AAACCTGAGTGTTTGC-1-0     normal
AAACCTGCAAACTGTC-1-0     normal
AAACCTGCACAACGTT-1-0     normal
                         ...
TTTGGTTTCGGAATCT-1-2    10h_LPS
TTTGTCAAGGCATGTG-1-2    10h_LPS
TTTGTCACAAAGGAAG-1-2    10h_LPS
TTTGTCATCAACACTG-1-2    10h_LPS
TTTGTCATCACAACGT-1-2    10h_LPS
Name: time_after_LPS, Length: 119360, dtype: category
Categories (4, object): ['normal', '10h_LPS', '6h_LPS', '90m_LPS']
combined_data.obs['study'] = 'Private_Data_Emily'
combined_data.obs['tissue'] = 'blood'
combined_data
AnnData object with n_obs × n_vars = 119360 × 19186
    obs: 'patient_id', 'time_after_LPS', 'Sex', 'age', 'batch', 'IR_VJ_1_locus_tcr', 'IR_VJ_2_locus_tcr', 'IR_VDJ_1_locus_tcr', 'IR_VDJ_2_locus_tcr', 'IR_VJ_1_cdr3_tcr', 'IR_VJ_2_cdr3_tcr', 'IR_VDJ_1_cdr3_tcr', 'IR_VDJ_2_cdr3_tcr', 'IR_VJ_1_cdr3_nt_tcr', 'IR_VJ_2_cdr3_nt_tcr', 'IR_VDJ_1_cdr3_nt_tcr', 'IR_VDJ_2_cdr3_nt_tcr', 'IR_VJ_1_expr_tcr', 'IR_VJ_2_expr_tcr', 'IR_VDJ_1_expr_tcr', 'IR_VDJ_2_expr_tcr', 'IR_VJ_1_expr_raw_tcr', 'IR_VJ_2_expr_raw_tcr', 'IR_VDJ_1_expr_raw_tcr', 'IR_VDJ_2_expr_raw_tcr', 'IR_VJ_1_v_gene_tcr', 'IR_VJ_2_v_gene_tcr', 'IR_VDJ_1_v_gene_tcr', 'IR_VDJ_2_v_gene_tcr', 'IR_VJ_1_d_gene_tcr', 'IR_VJ_2_d_gene_tcr', 'IR_VDJ_1_d_gene_tcr', 'IR_VDJ_2_d_gene_tcr', 'IR_VJ_1_j_gene_tcr', 'IR_VJ_2_j_gene_tcr', 'IR_VDJ_1_j_gene_tcr', 'IR_VDJ_2_j_gene_tcr', 'IR_VJ_1_c_gene_tcr', 'IR_VJ_2_c_gene_tcr', 'IR_VDJ_1_c_gene_tcr', 'IR_VDJ_2_c_gene_tcr', 'IR_VJ_1_junction_ins_tcr', 'IR_VJ_2_junction_ins_tcr', 'IR_VDJ_1_junction_ins_tcr', 'IR_VDJ_2_junction_ins_tcr', 'has_ir_tcr', 'multi_chain_tcr', 'IR_VJ_1_locus_bcr', 'IR_VJ_2_locus_bcr', 'IR_VDJ_1_locus_bcr', 'IR_VDJ_2_locus_bcr', 'IR_VJ_1_cdr3_bcr', 'IR_VJ_2_cdr3_bcr', 'IR_VDJ_1_cdr3_bcr', 'IR_VDJ_2_cdr3_bcr', 'IR_VJ_1_cdr3_nt_bcr', 'IR_VJ_2_cdr3_nt_bcr', 'IR_VDJ_1_cdr3_nt_bcr', 'IR_VDJ_2_cdr3_nt_bcr', 'IR_VJ_1_expr_bcr', 'IR_VJ_2_expr_bcr', 'IR_VDJ_1_expr_bcr', 'IR_VDJ_2_expr_bcr', 'IR_VJ_1_expr_raw_bcr', 'IR_VJ_2_expr_raw_bcr', 'IR_VDJ_1_expr_raw_bcr', 'IR_VDJ_2_expr_raw_bcr', 'IR_VJ_1_v_gene_bcr', 'IR_VJ_2_v_gene_bcr', 'IR_VDJ_1_v_gene_bcr', 'IR_VDJ_2_v_gene_bcr', 'IR_VJ_1_d_gene_bcr', 'IR_VJ_2_d_gene_bcr', 'IR_VDJ_1_d_gene_bcr', 'IR_VDJ_2_d_gene_bcr', 'IR_VJ_1_j_gene_bcr', 'IR_VJ_2_j_gene_bcr', 'IR_VDJ_1_j_gene_bcr', 'IR_VDJ_2_j_gene_bcr', 'IR_VJ_1_c_gene_bcr', 'IR_VJ_2_c_gene_bcr', 'IR_VDJ_1_c_gene_bcr', 'IR_VDJ_2_c_gene_bcr', 'IR_VJ_1_junction_ins_bcr', 'IR_VJ_2_junction_ins_bcr', 'IR_VDJ_1_junction_ins_bcr', 'IR_VDJ_2_junction_ins_bcr', 'has_ir_bcr', 'multi_chain_bcr', 'scr_th', 'doublet_scores', 'cal_th', 'scr_predicted_doublets', 'cal_dobulets', 'data_batch', 'individual_id', 'n_genes', 'n_genes_by_counts', 'total_counts', 'total_counts_mt', 'pct_counts_mt', 'cell_typist_full_predicted_labels', 'cell_typist_full_majority_voting', 'cell_typist_initial_predicted_labels', 'cell_typist_initial_majority_voting', 'final_anno', 'timeline', 'sample_id', 'all_T', 'final_anno1', 'all_B', 'log1p_n_genes_by_counts', 'log1p_total_counts', 'pct_counts_in_top_20_genes', 'log1p_total_counts_mt', 'total_counts_ribo', 'log1p_total_counts_ribo', 'pct_counts_ribo', 'total_counts_hb', 'log1p_total_counts_hb', 'pct_counts_hb', 'n_counts', 'cell_type', 'donor_id', 'study', 'tissue'
    var: 'gene_ids', 'mt', 'n_cells_by_counts', 'mean_counts', 'pct_dropout_by_counts', 'total_counts', 'GEX-0', 'GEX-2', 'ribo', 'hb', 'log1p_mean_counts', 'log1p_total_counts', 'n_cells'
combined_data.obs['age'].value_counts()
age
23.0    29443
37.0    29386
32.0    21621
36.0    18532
29.0    15735
24.0     4643
Name: count, dtype: int64
def age_to_group(age):
    if pd.isna(age):
        return 'Unknown'
    elif age < 0:
        # Prenatal age, optional handling
        return 'Prenatal'
    elif age <= 18:
        return 'Childhood'
    elif 18 < age <= 25:
        return 'Young Adult'
    elif 26 <= age <= 64:
        return 'Adult'
    elif age >= 65:
        return 'Old'
    else:
        return 'Unknown'

combined_data.obs['development_stage'] = combined_data.obs['age'].apply(age_to_group)

# Optionally convert to categorical with order:
combined_data.obs['development_stage'] = pd.Categorical(
    combined_data.obs['development_stage'],
    categories=['Prenatal', 'Childhood', 'Young Adult', 'Adult', 'Old', 'Unknown'],
    ordered=True
)
combined_data.obs['development_stage'].value_counts()
development_stage
Adult          85274
Young Adult    34086
Childhood          0
Prenatal           0
Old                0
Unknown            0
Name: count, dtype: int64
ref = pd.read_csv("../../../../Ensembl_symbol_Human_(GRCh38.p14)/mart_export.txt")
ref
| HGNC symbol | Gene stable ID | |
|---|---|---|
| 0 | MT-TF | ENSG00000210049 |
| 1 | MT-RNR1 | ENSG00000211459 |
| 2 | MT-TV | ENSG00000210077 |
| 3 | MT-RNR2 | ENSG00000210082 |
| 4 | MT-TL1 | ENSG00000209082 |
| ... | ... | ... |
| 86363 | SNHG12 | ENSG00000197989 |
| 86364 | TAF12-DT | ENSG00000229388 |
| 86365 | NaN | ENSG00000289291 |
| 86366 | RNU11 | ENSG00000274978 |
| 86367 | NaN | ENSG00000296488 |
86368 rows × 2 columns
# Current gene symbols from var_names
gene_symbols = combined_data.var_names.to_list()

# Create mapping: symbol -> Ensembl ID
symbol_to_ensembl = dict(zip(ref['HGNC symbol'], ref['Gene stable ID']))

# Map gene symbols to Ensembl IDs (or None if not found)
ensembl_ids = [symbol_to_ensembl.get(gene, None) for gene in gene_symbols]

# Create a mask to keep only genes with Ensembl IDs starting with "ENSG"
keep_mask = [ensembl is not None and ensembl.startswith("ENSG") for ensembl in ensembl_ids]

# Filter var and var_names accordingly
combined_data = combined_data[:, keep_mask].copy()  # subset cells and genes

# Update var_names to Ensembl IDs for kept genes
combined_data.var['ensembl_id'] = [ensembl_ids[i] for i, keep in enumerate(keep_mask) if keep]
combined_data.var_names = combined_data.var['ensembl_id'].values
combined_data.var['gene_symbol'] = combined_data.var['gene_ids']
combined_data.X.max()
2672.0
if hasattr(combined_data.X, 'sum'):
    combined_data.obs['n_counts'] = np.ravel(combined_data.X.sum(axis=1))
else:
    combined_data.obs['n_counts'] = combined_data.X.sum(axis=1)
combined_data.obs['cell_type']
AAACCTGAGACAAAGG-1-0           NKT
AAACCTGAGCGTTCCG-1-0     CD8_naive
AAACCTGAGTGTTTGC-1-0    CD4_memory
AAACCTGCAAACTGTC-1-0           NKT
AAACCTGCACAACGTT-1-0     CD4_naive
                           ...
TTTGGTTTCGGAATCT-1-2      Int.mono
TTTGTCAAGGCATGTG-1-2      Int.mono
TTTGTCACAAAGGAAG-1-2      CD14mono
TTTGTCATCAACACTG-1-2      CD14mono
TTTGTCATCACAACGT-1-2      CD14mono
Name: cell_type, Length: 119360, dtype: category
Categories (30, object): ['ASDC', 'B_naive', 'CD4_memory', 'CD4_naive', ..., 'plasma_IgG', 'plasma_IgM', 'plasma_dividing', 'switched memory']
combined_data.write_h5ad('./raw_data_LPS_Private_Haniffa_lab.h5ad') # save the processed data
1.3. Concatenation of public and preprocessed prived data
adata1 = sc.read('./Private_emily/raw_data_LPS_Private_Haniffa_lab.h5ad')
/nfs/users/nfs_a/am74/.cache/pypoetry/virtualenvs/cytomeister-AO4Zveyp-py3.10/lib/python3.10/site-packages/anndata/_core/anndata.py:1756: UserWarning: Variable names are not unique. To make them unique, call `.var_names_make_unique`.
  utils.warn_names_duplicates("var")
adata2 = sc.read('./Public_Emily/Public_LPS_PP.h5ad')
# Make var_names unique to avoid conflicts during concatenation
adata2.var_names_make_unique()
adata1.var_names_make_unique()
# Concatenate the two datasets
adata = adata1.concatenate(adata2)
/tmp/ipykernel_983311/3094885911.py:1: FutureWarning: Use anndata.concat instead of AnnData.concatenate, AnnData.concatenate is deprecated and will be removed in the future. See the tutorial for concat at: https://anndata.readthedocs.io/en/latest/concatenation.html
  adata = adata1.concatenate(adata2)
adata # check the merged data
AnnData object with n_obs × n_vars = 224150 × 13826
    obs: 'patient_id', 'time_after_LPS', 'Sex', 'age', 'batch', 'IR_VJ_1_locus_tcr', 'IR_VJ_2_locus_tcr', 'IR_VDJ_1_locus_tcr', 'IR_VDJ_2_locus_tcr', 'IR_VJ_1_cdr3_tcr', 'IR_VJ_2_cdr3_tcr', 'IR_VDJ_1_cdr3_tcr', 'IR_VDJ_2_cdr3_tcr', 'IR_VJ_1_cdr3_nt_tcr', 'IR_VJ_2_cdr3_nt_tcr', 'IR_VDJ_1_cdr3_nt_tcr', 'IR_VDJ_2_cdr3_nt_tcr', 'IR_VJ_1_expr_tcr', 'IR_VJ_2_expr_tcr', 'IR_VDJ_1_expr_tcr', 'IR_VDJ_2_expr_tcr', 'IR_VJ_1_expr_raw_tcr', 'IR_VJ_2_expr_raw_tcr', 'IR_VDJ_1_expr_raw_tcr', 'IR_VDJ_2_expr_raw_tcr', 'IR_VJ_1_v_gene_tcr', 'IR_VJ_2_v_gene_tcr', 'IR_VDJ_1_v_gene_tcr', 'IR_VDJ_2_v_gene_tcr', 'IR_VJ_1_d_gene_tcr', 'IR_VJ_2_d_gene_tcr', 'IR_VDJ_1_d_gene_tcr', 'IR_VDJ_2_d_gene_tcr', 'IR_VJ_1_j_gene_tcr', 'IR_VJ_2_j_gene_tcr', 'IR_VDJ_1_j_gene_tcr', 'IR_VDJ_2_j_gene_tcr', 'IR_VJ_1_c_gene_tcr', 'IR_VJ_2_c_gene_tcr', 'IR_VDJ_1_c_gene_tcr', 'IR_VDJ_2_c_gene_tcr', 'IR_VJ_1_junction_ins_tcr', 'IR_VJ_2_junction_ins_tcr', 'IR_VDJ_1_junction_ins_tcr', 'IR_VDJ_2_junction_ins_tcr', 'has_ir_tcr', 'multi_chain_tcr', 'IR_VJ_1_locus_bcr', 'IR_VJ_2_locus_bcr', 'IR_VDJ_1_locus_bcr', 'IR_VDJ_2_locus_bcr', 'IR_VJ_1_cdr3_bcr', 'IR_VJ_2_cdr3_bcr', 'IR_VDJ_1_cdr3_bcr', 'IR_VDJ_2_cdr3_bcr', 'IR_VJ_1_cdr3_nt_bcr', 'IR_VJ_2_cdr3_nt_bcr', 'IR_VDJ_1_cdr3_nt_bcr', 'IR_VDJ_2_cdr3_nt_bcr', 'IR_VJ_1_expr_bcr', 'IR_VJ_2_expr_bcr', 'IR_VDJ_1_expr_bcr', 'IR_VDJ_2_expr_bcr', 'IR_VJ_1_expr_raw_bcr', 'IR_VJ_2_expr_raw_bcr', 'IR_VDJ_1_expr_raw_bcr', 'IR_VDJ_2_expr_raw_bcr', 'IR_VJ_1_v_gene_bcr', 'IR_VJ_2_v_gene_bcr', 'IR_VDJ_1_v_gene_bcr', 'IR_VDJ_2_v_gene_bcr', 'IR_VJ_1_d_gene_bcr', 'IR_VJ_2_d_gene_bcr', 'IR_VDJ_1_d_gene_bcr', 'IR_VDJ_2_d_gene_bcr', 'IR_VJ_1_j_gene_bcr', 'IR_VJ_2_j_gene_bcr', 'IR_VDJ_1_j_gene_bcr', 'IR_VDJ_2_j_gene_bcr', 'IR_VJ_1_c_gene_bcr', 'IR_VJ_2_c_gene_bcr', 'IR_VDJ_1_c_gene_bcr', 'IR_VDJ_2_c_gene_bcr', 'IR_VJ_1_junction_ins_bcr', 'IR_VJ_2_junction_ins_bcr', 'IR_VDJ_1_junction_ins_bcr', 'IR_VDJ_2_junction_ins_bcr', 'has_ir_bcr', 'multi_chain_bcr', 'scr_th', 'doublet_scores', 'cal_th', 'scr_predicted_doublets', 'cal_dobulets', 'data_batch', 'individual_id', 'n_genes', 'n_genes_by_counts', 'total_counts', 'total_counts_mt', 'pct_counts_mt', 'cell_typist_full_predicted_labels', 'cell_typist_full_majority_voting', 'cell_typist_initial_predicted_labels', 'cell_typist_initial_majority_voting', 'final_anno', 'timeline', 'sample_id', 'all_T', 'final_anno1', 'all_B', 'log1p_n_genes_by_counts', 'log1p_total_counts', 'pct_counts_in_top_20_genes', 'log1p_total_counts_mt', 'total_counts_ribo', 'log1p_total_counts_ribo', 'pct_counts_ribo', 'total_counts_hb', 'log1p_total_counts_hb', 'pct_counts_hb', 'n_counts', 'cell_type', 'donor_id', 'study', 'tissue', 'development_stage', 'full_clustering', 'initial_clustering', 'Resample', 'Collection_Day', 'Age_interval', 'Swab_result', 'Status', 'Smoker', 'Status_on_day_collection', 'Status_on_day_collection_summary', 'Days_from_onset', 'Site', 'Worst_Clinical_Status', 'Outcome', 'life_stage'
    var: 'gene_ids-0', 'mt-0', 'n_cells_by_counts-0', 'mean_counts-0', 'pct_dropout_by_counts-0', 'total_counts-0', 'GEX-0-0', 'GEX-2-0', 'ribo-0', 'hb-0', 'log1p_mean_counts-0', 'log1p_total_counts-0', 'n_cells-0', 'ensembl_id-0', 'gene_symbol-0', 'ensembl_id-1', 'gene_symbol-1', 'feature_types-1'
adata.obs['time_after_LPS'].value_counts() # check time points available
time_after_LPS
normal     148742
6h_LPS      43810
10h_LPS     20890
90m_LPS     10708
Name: count, dtype: int64
adata.obs['cell_type'].value_counts() # check cell types available
cell_type
CD14mono                     23888
CD4_naive                    18268
B_naive                      15093
CD4.Naive                    13829
NK_16hi                      13473
CD8_naive                    13249
CD4_memory                   10259
CD8_EM                        8869
gdT                           8273
CD8.Naive                     8105
CD4.CM                        7505
Int.mono                      7229
CD83_CD14_mono                6772
CD8.TE                        6501
CD4.IL22                      6379
MAIT                          6042
CD8.EM                        5734
NK_CD56dim                    4922
CD14mono_M1                   4129
CD14_mono                     3774
NKT                           3240
CD16_mono                     3007
Treg                          2457
Platelets                     2363
NK_56hi                       2190
DC2                           2024
non-swtiched memory           1583
DC3                           1463
B_switched_memory             1395
pDC                           1374
CD16mono                      1213
switched memory               1158
CD8_CM                        1004
B_immature                     966
Platelet                       862
NK_CD56bright                  856
CD4.Tfh                        800
B_non-switched_memory          647
B_exhausted                    334
non-switched memory/CD11c      301
RBC                            301
HSPC                           227
NK_prolif                      221
ILC1_3                         213
C1_CD16_mono                   198
CD4.EM                         188
Plasma_cell_IgA                173
Plasma_cell_IgG                168
DC1                            164
plasma_IgA                     160
CD4.Th1                        101
Plasmablast                     95
Plasma_cell_IgM                 84
HSC_erythroid                   74
CD8.Prolif                      70
HSC_CD38pos                     61
plasma_dividing                 50
plasma_IgG                      31
ASDC                            23
plasma_IgM                      18
Name: count, dtype: int64
# Define a mapping dictionary for renaming
cell_type_mapping = {
    # Monocytes
    "CD14mono": "CD14 monocytes",
    "CD14_mono": "CD14 monocytes",
    "CD83_CD14_mono": "CD14 monocytes",
    "CD14mono_M1": "CD14 monocytes",
    "CD16_mono": "CD16 monocytes",
    "CD16mono": "CD16 monocytes",
    "C1_CD16_mono": "CD16 monocytes",
    # CD4 T cells
    "CD4_naive": "CD4+ T cells",
    "CD4.Naive": "CD4+ T cells",
    "CD4_memory": "CD4+ T cells",
    "CD4.CM": "CD4+ T cells",
    "CD4.Tfh": "CD4+ T cells",
    "CD4.Th1": "CD4+ T cells",
    "CD4.IL22": "CD4+ T cells",
    "CD4.EM": "CD4+ T cells",
    # CD8 T cells
    "CD8_naive": "CD8+ T cells",
    "CD8.Naive": "CD8+ T cells",
    "CD8_EM": "CD8+ T cells",
    "CD8.EM": "CD8+ T cells",
    "CD8_CM": "CD8+ T cells",
    "CD8.TE": "CD8+ T cells",
    "CD8.Prolif": "CD8+ T cells",
    # NK cells
    "NK_16hi": "NK",
    "NK_56hi": "NK",
    "NK_CD56dim": "NK",
    "NK_CD56bright": "NK",
    "NK_prolif": "NK",
    # B cells
    "B_naive": "B cell",
    "B_switched_memory": "B cell",
    "non-swtiched memory" : "B cell",
    "switched memory": "B cell",
    "B_non-switched_memory": "B cell",
    "non-switched memory": "B cell",
    "non-switched memory/CD11c": "B cell",
    "B_immature": "B cell",
    "B_exhausted": "B cell",
    # Plasma cells
    "Plasma_cell_IgA": "plasma cell",
    "plasma_IgA": "plasma cell",
    "Plasma_cell_IgG": "plasma cell",
    "plasma_IgG": "plasma cell",
    "Plasma_cell_IgM": "plasma cell",
    "plasma_IgM": "plasma cell",
    "Plasmablast": "plasma cell",
    "plasma_dividing": "plasma cell",
    # Others
    "Platelets": "platelet",
    "Platelet": "platelet",
    "Treg": "regulatory T cell",
    "MAIT": "mucosal invariant T cell",
    "gdT": "gamma-delta T cell",
    "NKT": "NKT",
    "pDC": "Plasmocytoid dendritic cell",
    "DC1": "Dendritic cells",
    "DC2": "Dendritic cells",
    "DC3": "Dendritic cells",
    "ASDC": "ASDC",
    "Int.mono": "CD14 monocytes",
    "RBC": "Red_Blood_Cell",
    "HSPC": "hematopoietic stem cell",
    "HSC_erythroid": "HSC_Erythroid",
    "HSC_CD38pos": "HSC_CD38pos",
    "ILC1_3": "ILC1_3",
}

# Apply the mapping to adata.obs['cell_type']
adata.obs['cell_type_harmonized'] = adata.obs['cell_type'].map(cell_type_mapping).fillna(adata.obs['cell_type'])

# Verify the new counts
print(adata.obs['cell_type_harmonized'].value_counts())
cell_type_harmonized
CD4+ T cells                   57329
CD14 monocytes                 45792
CD8+ T cells                   43532
NK                             21662
B cell                         21477
gamma-delta T cell              8273
mucosal invariant T cell        6042
CD16 monocytes                  4418
Dendritic cells                 3651
NKT                             3240
platelet                        3225
regulatory T cell               2457
Plasmocytoid dendritic cell     1374
plasma cell                      779
Red_Blood_Cell                   301
hematopoietic stem cell          227
ILC1_3                           213
HSC_Erythroid                     74
HSC_CD38pos                       61
ASDC                              23
Name: count, dtype: int64
# Get unique timepoints
all_timepoints = adata.obs['time_after_LPS'].unique()

# Group by cell_type and get unique timepoints per cell type
cell_type_timepoints = (
    adata.obs
    .groupby('cell_type_harmonized')['time_after_LPS']
    .unique()
    .apply(list)
)

# Find cell types that do not appear in all timepoints
missing_in_any_timepoint = [
    ct for ct in cell_type_timepoints.index
    if not set(all_timepoints).issubset(set(cell_type_timepoints[ct]))
]

print("Cell types not present in all timepoints:", missing_in_any_timepoint)
Cell types not present in all timepoints: ['ASDC', 'HSC_CD38pos', 'HSC_Erythroid', 'ILC1_3', 'Red_Blood_Cell']
adata = sc.read('./full_lps.h5ad')
cell_types_to_remove = ['ASDC', 'HSC_CD38pos', 'HSC_Erythroid', 'ILC1_3', 'Red_Blood_Cell']
keep_mask = ~adata.obs['cell_type_harmonized'].isin(cell_types_to_remove)
adata_filtered = adata[keep_mask, :].copy()
adata_filtered.obs['cell_type_harmonized'].value_counts()
cell_type_harmonized
CD4+ T cells                   57329
CD14 monocytes                 45792
CD8+ T cells                   43532
NK                             21662
B cell                         21477
gamma-delta T cell              8273
mucosal invariant T cell        6042
CD16 monocytes                  4418
Dendritic cells                 3651
NKT                             3240
platelet                        3225
regulatory T cell               2457
Plasmocytoid dendritic cell     1374
plasma cell                      779
hematopoietic stem cell          227
Name: count, dtype: int64
len(set(adata_filtered.obs['cell_type_harmonized']))
15
adata_filtered.X.max()
np.float32(4066.0)
adata_filtered.write_h5ad('./full_lps.h5ad') # save the final processed data